Index I Cross Country I Track Relays I Multi-Events
Please note that the number of events offered has increased over the years, particularly for the younger age groups and women,
but the county has decreased in size - Details of changes in county boundary
SUMMARY I 88 I 93 I 94 I 95 I 96 I 97 I 98 I 99 I 00 I 01 I 02 I 03 I 04 I 05 I 06 I 07 I 08 I 09 I 10 I 11 I 12 I 13
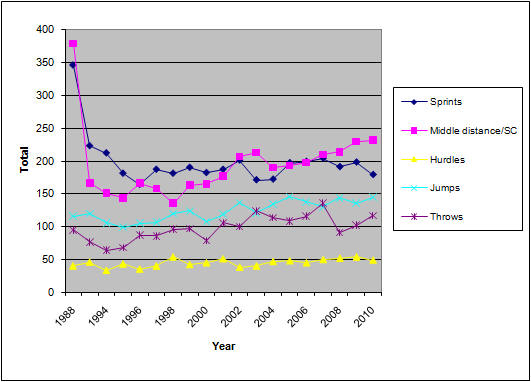
| Sprints | Middle distance/SC | Hurdles | Jumps | Throws | Total |
| 1988 | 346 | 379 | 40 | 116 | 95 | 976 |
| 1993 | 223 | 167 | 46 | 120 | 77 | 633 |
| 1994 | 212 | 151 | 33 | 106 | 64 | 566 |
| 1995 | 181 | 144 | 43 | 99 | 68 | 535 |
| 1996 | 164 | 166 | 35 | 105 | 87 | 557 |
| 1997 | 187 | 158 | 40 | 107 | 86 | 578 |
| 1998 | 181 | 136 | 54 | 120 | 96 | 587 |
| 1999 | 190 | 163 | 42 | 124 | 97 | 616 |
| 2000 | 182 | 165 | 45 | 108 | 79 | 579 |
| 2001 | 187 | 177 | 51 | 119 | 106 | 640 |
| 2002 | 201 | 207 | 38 | 137 | 100 | 683 |
| 2003 | 171 | 213 | 40 | 121 | 124 | 669 |
| 2004 | 172 | 190 | 47 | 134 | 114 | 657 |
| 2005 | 197 | 193 | 48 | 146 | 109 | 693 |
| 2006 | 199 | 198 | 45 | 138 | 116 | 696 |
| 2007 | 204 | 209 | 50 | 130 | 136 | 729 |
| 2008 | 191 | 214 | 52 | 144 | 91 | 692 |
| 2009 | 190 | 230 | 54 | 136 | 102 | 720 |
| 2010 | 179 | 232 | 49 | 145 | 117 | 722 |
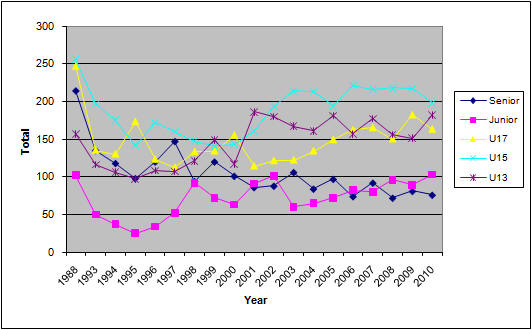
| Year | Senior | Junior | U17 | U15 | U13 |
| 1988 | 214 | 102 | 247 | 256 | 157 |
| 1993 | 135 | 50 | 135 | 197 | 116 |
| 1994 | 118 | 37 | 130 | 175 | 106 |
| 1995 | 98 | 25 | 173 | 142 | 97 |
| 1996 | 120 | 34 | 123 | 172 | 108 |
| 1997 | 147 | 52 | 112 | 160 | 107 |
| 1998 | 94 | 92 | 133 | 147 | 121 |
| 1999 | 120 | 72 | 134 | 141 | 149 |
| 2000 | 101 | 63 | 155 | 143 | 117 |
| 2001 | 86 | 91 | 114 | 161 | 186 |
| 2002 | 88 | 101 | 121 | 193 | 180 |
| 2003 | 106 | 60 | 122 | 214 | 167 |
| 2004 | 84 | 65 | 134 | 213 | 161 |
| 2005 | 97 | 72 | 149 | 194 | 181 |
| 2006 | 74 | 82 | 162 | 221 | 157 |
| 2007 | 91 | 80 | 165 | 216 | 177 |
| 2008 | 72 | 96 | 150 | 218 | 156 |
| 2009 | 81 | 89 | 182 | 217 | 151 |
| 2010 | 76 | 103 | 163 | 198 | 182 |
SUMMARY I 88 I 93 I 94 I 95 I 96 I 97 I 98 I 99 I 00 I 01 I 02 I 03 I 04 I 05 I 06 I 07 I 08 I 09 I 10 I 11 I 12 I 13